Research and Academic Writing for Graduate Students · Part 4
Before making a results table
After formulating a question and, where appropriate, a hypothesis, students often ask:
“How many comparison models should I include?”
“Which ablations should I run?”
These questions matter. First, ask:
What claim is this experiment intended to support?
An IoU increase from 0.70 to 0.72 is a difference of 0.02, or 2 percentage points when expressed as a percentage. Whether it supports an improvement, explains its cause, or establishes performance at new sites are different questions. They require different evidence.
All numbers, construction-document AI scenarios, and crack-segmentation scenarios in this article are hypothetical, not reported results from the cited papers.
Match the evidence to the claim
| Intended claim | Examples of relevant evidence |
|---|---|
| The method performs better | Relevant strong baselines, reasonable tuning, and consistent evaluation conditions |
| A design element contributes to improvement | Comparisons that separate its effect from other changes |
| The method works at new sites | Evaluation on sites excluded from training |
| The method is useful in practice | Task-relevant errors, time, cost, and operating conditions |
This does not mean every study must make all four claims. Select experiments needed for the claims your paper actually makes. Many experiments do not compensate for failing to examine the central claim.
Example 1: Does explicit clause structure improve RAG judgments?
Suppose the question is:
With the same evidence, does explicitly representing conditions and exceptions between clauses improve an LLM’s judgment accuracy?
If the new system changes the model, improves retrieval, and supplies more information, the comparison can evaluate the complete system. It cannot by itself isolate the effect of relationship representation.
A suitable design could compare representations using the same model, question set, and substantive evidence. Check whether one representation adds facts that reveal the answer, or whether length and ordering offer alternative explanations. The goal is to separate the difference of interest from other differences, not to make every input string identical.
Distinguish an oracle evidence experiment, which directly supplies the required evidence, from an end-to-end experiment that performs retrieval too. The former examines interpretation given the evidence; the latter includes retrieval failures. Together, they can help locate difficulties.
Depending on the claim, assess interpretation of conditions and exceptions, use of evidence, or responses to unanswerable questions alongside final accuracy. Define scoring criteria before examining results. When people judge answers, describe the rating process and how disagreements are handled.
Fair comparison does not mean identical settings
Choose baselines for their roles. A simple meaningful method, a competitive method for the task, and a control for the proposed component may answer different questions. Including many famous models is not sufficient by itself.
Fairness also does not require forcing every model to use the same learning rate or number of epochs. Appropriate training conditions may differ. Keep data splits and evaluation criteria consistent, allow reasonable tuning, and report search ranges and computational resources.
An efficiency claim calls for time, memory, or computation measurements. A claim about a particular design may require controls for capacity or training effort. What to match depends on the purpose of the comparison.
Example 2: How do you show that fewer thin cracks are missed?
If the hypothesis concerns preserving high-resolution features to reduce missed thin cracks, overall IoU may not be sufficient.
First define “thin.” Does it mean a specified pixel width in the source image, or a physical crack width? Pixel width changes with resolution, capture distance, and resizing.
Choose measures that address the claim. Candidates include missed thin cracks or recall, false positives, connectivity, and length error. You need not use every measure, but should explain what each selected measure captures. Connectivity evaluation also depends on how the reference masks and preprocessing define and preserve connected structures.
Reinke and colleagues (2024) examine pitfalls in selecting and using image-analysis validation metrics, primarily in biomedical imaging.[1] Here, the principle of matching metrics to the task is applied to an engineering example; their paper does not test this hypothetical crack hypothesis.
Specify the aggregation unit too. IoU calculated from pooled pixels can differ from the mean of image-level IoUs. Consider which images or sites receive greater weight in the reported result.
What an ablation establishes—and what remains open
If removing component A reduces performance, that supports the usefulness of including A under the evaluated conditions. Removal may also change capacity, feature resolution, or training behavior. The performance difference alone does not establish the proposed mechanism.
Useful additional comparisons might include a control with similar capacity, a different way of preserving resolution, or direct observation of the intermediate phenomenon being claimed. If the interaction between A and B is central, compare neither, A only, B only, and both. Every study does not require every possible combination.
Two thousand crops are not automatically two thousand independent samples
Making 20 crops from each of 100 source photos produces 2,000 files. Crops from the same photo are related, so they are not automatically 2,000 independent samples. The 100 photos may also be dependent if they come from the same site or structure.
Hurlbert’s (1984) classic paper examines pseudoreplication in ecological field experiments.[2] It is not a study of deep-learning crop counts. Here it provides a useful perspective on why the number of recorded observations can differ from the independent units relevant to inference.
Match the split to the intended evaluation:
- For new source photos, split by source image, then create crops within each split. If crops already exist, group them using source-image identifiers.
- For new sites, separate training and evaluation data by site.
- For future data, respect time order and the information actually available at prediction time.
Roberts and colleagues (2017) discuss cross-validation for temporally, spatially, hierarchically, and otherwise structured data. Splitting should match the prediction target; larger blocks are not always better. Blocking can turn the evaluation into an extrapolation task.[3]
Distinguish dependence between training and test data, which can make evaluation optimistic, from dependence among test observations, which affects uncertainty calculations. The dependence structure can matter both when making splits and when estimating uncertainty.
How long did the test data remain unseen?
If you repeatedly choose models or prompts using test results, the test set has effectively become development data. Cawley and Talbot (2010) analyze overfitting in model selection and the resulting evaluation bias.[4]
Separate training, development, and final evaluation, or use a cross-validation procedure appropriate to the study. State how evaluation results informed decisions. There is no universal split ratio that every study must use.
For RAG, including evaluation documents in the retrieval index is not automatically leakage. It may be required when those documents would be available in the intended application. Including answer labels or private evaluation explanations, or choosing systems based on test results, raises separate concerns.
Which variation do repeated runs measure?
A single run provides limited evidence about stability. Bouthillier and colleagues (2021) discuss sources of variation in machine-learning benchmarks, including data sampling, initialization, and hyperparameters.[5]
Changing random seeds examines variation under the selected running conditions. It does not automatically establish generalization to new sites or uncertainty from sampling the target population. State which variation you measured and choose repetition counts according to the purpose, observed variability, and available resources. There is no universally sufficient number.
Report the magnitude of the difference, its uncertainty, and whether it matters in practice. Multiple seeds evaluated on the same test data should not be treated as entirely independent new test samples.
Five sentences to write before running the experiment
- The claim this experiment will examine is ___.
- The conditions that must be compared are ___.
- The splitting and independent units are ___, and the evaluation target is ___.
- The measures and interpretation criteria are ___.
- An alternative explanation is ___, which we will examine through ___.
Record model settings, data splits, preprocessing, and evaluation procedures so others can understand and reproduce the work. Before filling a table, write the sentence that the table could support. Experimental design connects a question to a conclusion through appropriate evidence.
References and reading notes
- Reinke, A., Tizabi, M. D., Baumgartner, M., et al. (2024). Understanding metric-related pitfalls in image analysis validation. Nature Methods, 21(2), 182–194. DOI
- Hurlbert, S. H. (1984). Pseudoreplication and the design of ecological field experiments. Ecological Monographs, 54(2), 187–211. DOI
- Roberts, D. R., Bahn, V., Ciuti, S., et al. (2017). Cross-validation strategies for data with temporal, spatial, hierarchical, or phylogenetic structure. Ecography, 40(8), 913–929. DOI
- Cawley, G. C., & Talbot, N. L. C. (2010). On over-fitting in model selection and subsequent selection bias in performance evaluation. Journal of Machine Learning Research, 11, 2079–2107. Full text
- Bouthillier, X., Delaunay, P., Bronzi, M., et al. (2021). Accounting for variance in machine learning benchmarks. Proceedings of Machine Learning and Systems, 3. Official proceedings
Roberts and colleagues’ paper appeared online in 2016 and in its volume and issue in 2017. Reinke and colleagues’ DOI contains “2023,” but the citation above follows the 2024 publication. Long author lists are abbreviated for readability.
A visual recap
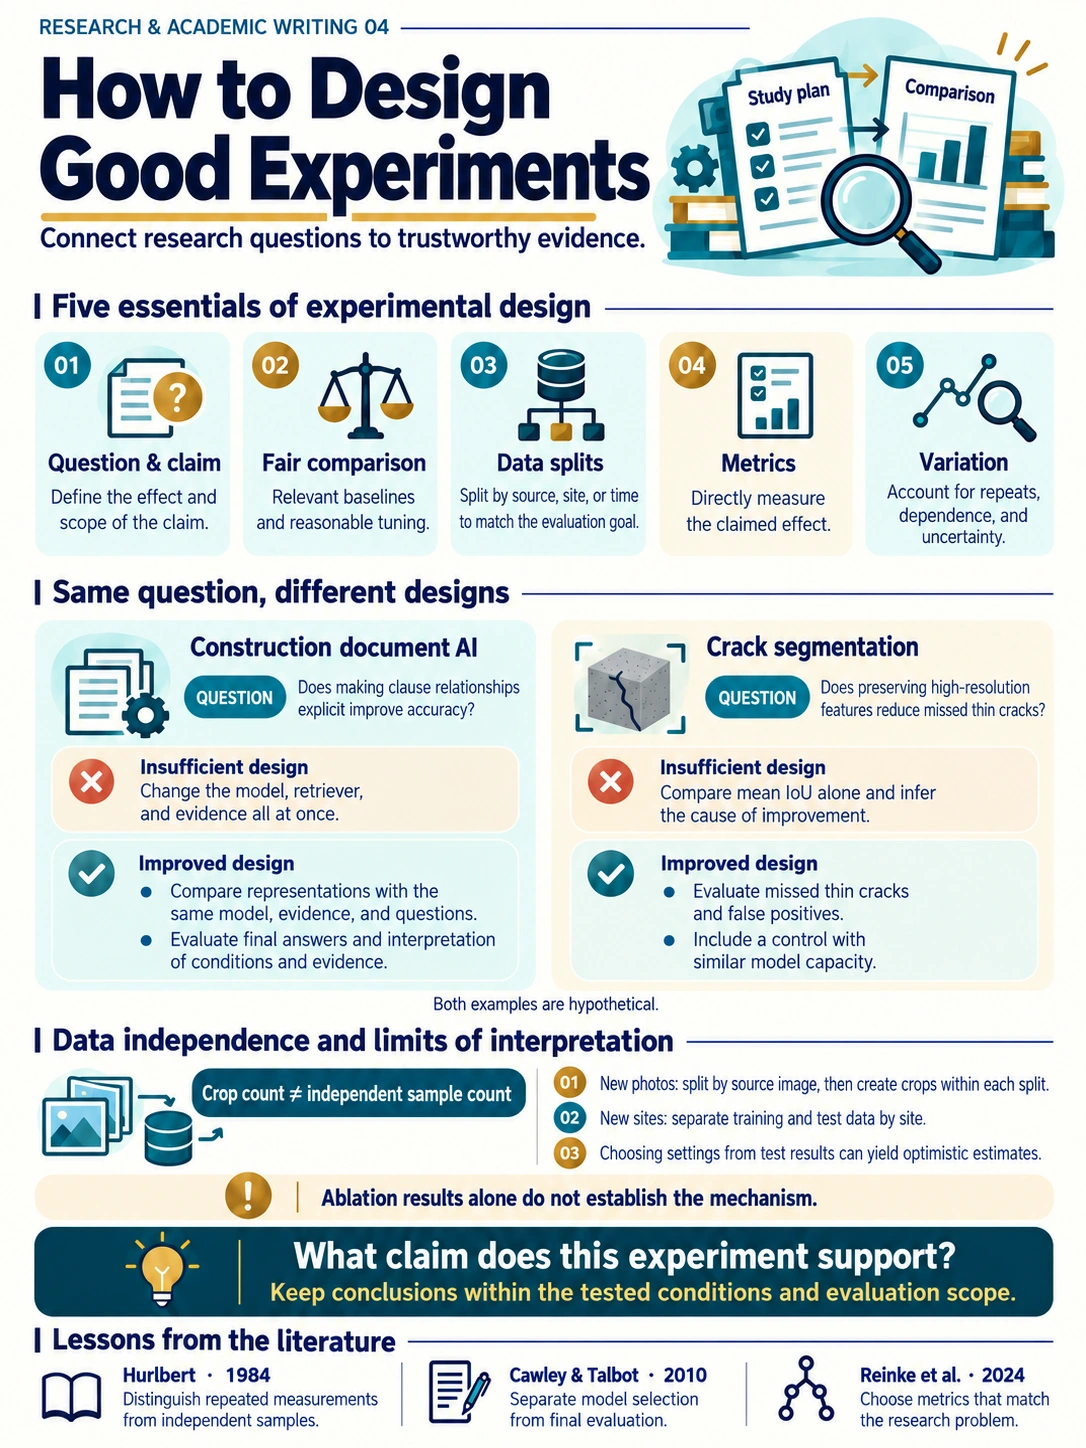
Select the image to view it at full size.
Research and Academic Writing for Graduate Students