A promising safety technology—but how do you justify the budget?
Imagine proposing AI cameras or smart safety equipment for a construction site. Detecting hazards earlier sounds valuable. Yet a purchasing meeting soon raises another question: How much investment makes sense for this particular project?
Equipment prices appear on a quotation. The losses avoided by preventing an accident do not. Accident timing, work stoppages, and the real-world impact of a technology are uncertain.
A study involving Yonsei University's Smart Infrastructure Lab addresses this gap through ECOSTAT, a framework for the economic evaluation of safety technology adoption. It connects implementation costs with estimated accident-prevention benefits to identify how effective a technology would need to be to break even under specified project conditions.
At a glance: ECOSTAT combines project characteristics, accident-related costs, and technology investment to explore break-even conditions. Its results are scenario estimates—not a product performance guarantee or a universal investment rule.
1. Detection accuracy is not accident-prevention effectiveness
An AI system that accurately detects missing hard hats does not necessarily reduce fatal accidents by the same percentage. Alerts must reach the right people, trigger a response, and change unsafe work practices.
In this paper, safety efficiency means effectiveness in reducing fatal accidents, not image-recognition accuracy. ECOSTAT does not measure that effectiveness directly. It varies assumed effectiveness and investment levels to ask when the estimated benefits would cover the costs.
For practitioners, this makes field evidence, deployment coverage, and response procedures just as important as a vendor's technical performance metrics.
2. Look beyond the equipment price
The framework considers five accident-related cost components borne by construction companies:
| Component | Practical meaning |
|---|---|
| Settlement costs | Payments associated with settlements with bereaved families |
| Legal costs | Legal responses following an accident |
| Investigation costs | Accident investigations and safety inspections |
| Interrupted construction costs | Labor and equipment costs during work stoppages |
| Fines | Penalties under the domestic regulatory scenario used in the paper |
The idea is to compare technology costs with losses that prevention could avoid. These components do not capture the full human or social consequences of an accident. The calculation is not a valuation of a person's life.
3. Explore many possible futures
Settlement amounts and work-stoppage durations vary. Instead of assuming one fixed amount for every accident, ECOSTAT uses distributions informed by available data and repeatedly samples possible combinations. This is Monte Carlo simulation: a way to explore uncertain outcomes through repeated calculations.
The paper models variability in settlements, interruption-related costs, and fines. Legal and investigation costs remain fixed because data are limited. It runs 1,000 simulations for each project-cost interval and uses the mean results in its evaluation.
The workflow has three stages:
- Estimate baseline exposure using project characteristics, workforce, duration, and historical fatality rates.
- Estimate the costs that accident prevention could avoid.
- Vary technology investment and effectiveness to identify break-even conditions.
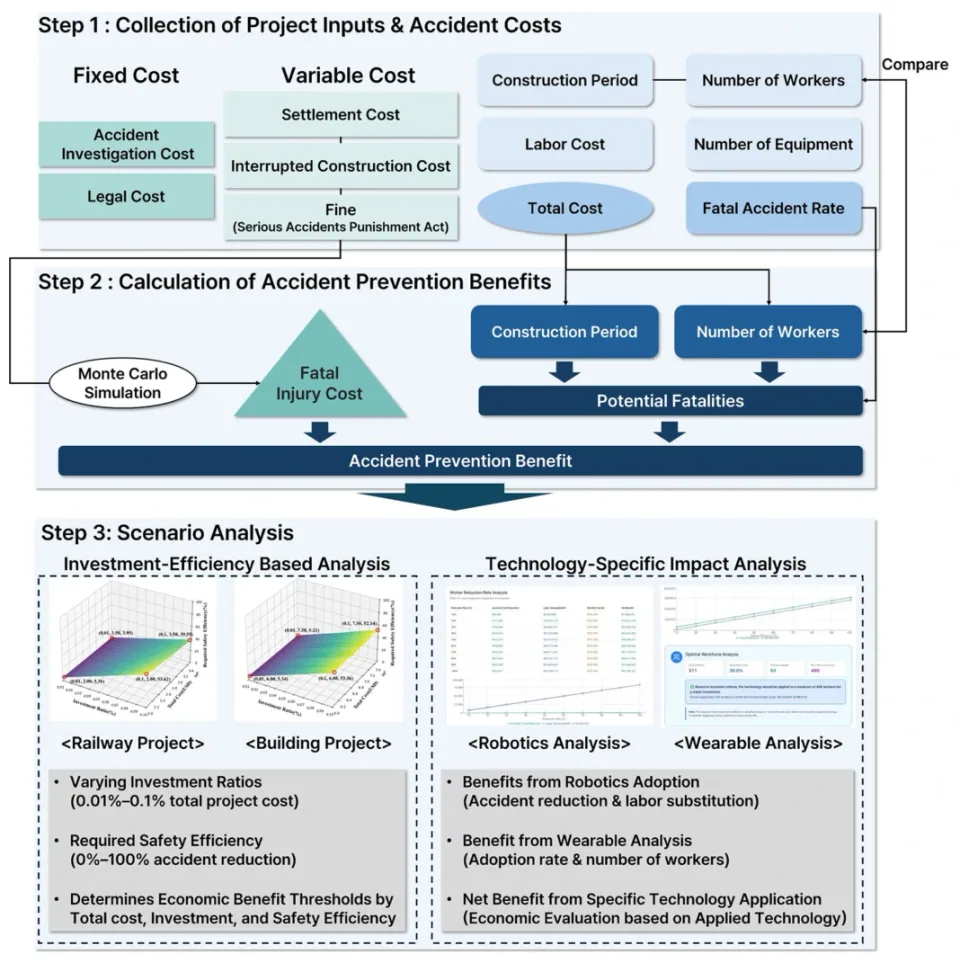
Break-even means that estimated prevention benefits equal implementation costs within the model. It does not mean that a particular project will necessarily realize those cash savings. The paper compares nominal costs and benefits without discounting future amounts to present value.
4. The same investment ratio can lead to different answers
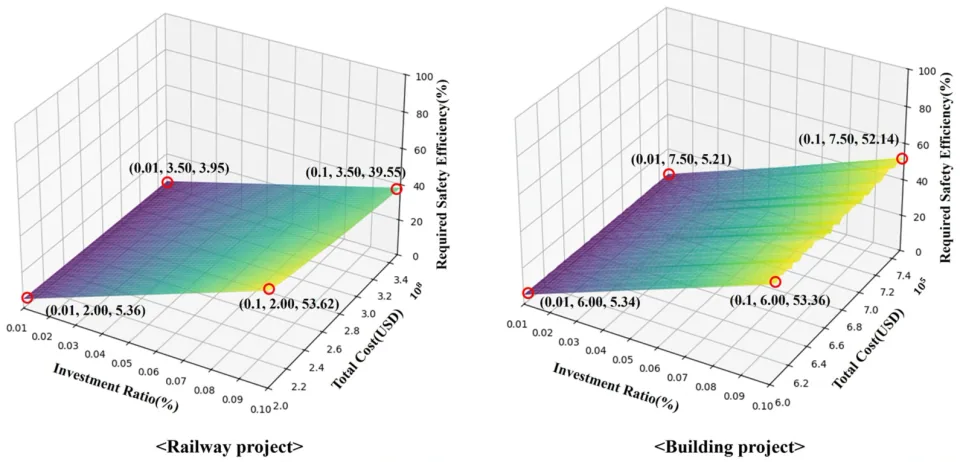
The study examines a Korean railway project and a hypothetical building project, with some costs adapted from the railway case. The following railway scenarios are reported in the paper; currency remains in US dollars.
| Total construction cost | Technology investment ratio | Required minimum prevention effectiveness |
|---|---|---|
| $200 million | 0.01% of project cost | 5.36% |
| $350 million | 0.01% of project cost | 3.95% |
| $200 million | 0.1% of project cost | 53.62% |
| $350 million | 0.1% of project cost | 39.55% |
The first row means that, under that scenario's cost and risk assumptions, investing 0.01% of project cost requires approximately 5.36% effectiveness in preventing fatal accidents to reach break-even. It does not report a measured reduction achieved by a specific device.
In the railway analysis, larger projects require lower effectiveness at the same investment ratio. The building scenarios show a much smaller change: at a 0.1% investment ratio, increasing project cost from $600,000 to $750,000 reduces the required effectiveness from 53.36% to 52.14%. Project scale matters, but so do risk and cost structure.
5. Bring better questions to the purchasing meeting
The practical value is not a single instruction to buy or reject a technology. It is a structured way to identify what needs evidence or adjustment.
- Check the project inputs. Do the assumed workforce, duration, and risks fit the site?
- Check the full implementation cost. Include installation, operation, and maintenance over the relevant deployment period.
- Check the evidence for effectiveness. Do not substitute detection accuracy for accident reduction. Where evidence is weak, compare conservative, middle, and optimistic scenarios.
- Compare alternatives. If expected effectiveness falls below break-even, examine price, deployment scope, operating procedures, or another technology.
The paper also implements a web-based system with three analysis modes: finding the required effectiveness threshold; assessing robots with workforce substitution and labor-cost savings; and assessing worker-level equipment using unit cost and adoption coverage. For students, a useful exercise is to change the investment ratio first, then project scale, and explain why the required effectiveness changes.
6. What the numbers do not tell you
The findings depend on two project types and Korean data. The building case is hypothetical. Applications elsewhere require recalibrating costs, fatality rates, and project-duration assumptions. The study does not model interactions between several technologies deployed together.
Nonfatal injuries, company-level reputation and bidding effects, and some productivity benefits are outside the current calculation. A break-even point based on mean estimates is not a probability of earning a positive return or a measure of worst-case losses. Uncertainty in both cost and actual effectiveness still needs attention.
A low economic estimate is not a reason to omit necessary safety measures. The framework supports a more concrete discussion of additional technology budgets and expected benefits while keeping safety as the underlying objective.
The question becomes: “What effect would this technology need to achieve at this price on our site—and how strong is the evidence that it can achieve it?”
About the paper
Jaehyon Park, Seungwon Baek, Taegeon Kim, Namgyun Kim, and Hongjo Kim (2026). Scenario-Based Framework for Economic Evaluation of Safety Technology Adoption in Construction. Journal of Management in Engineering, 42(6), 04026049. Published online August 13, 2026.
Read the paper · Supplemental materials
About the Author